 |
|

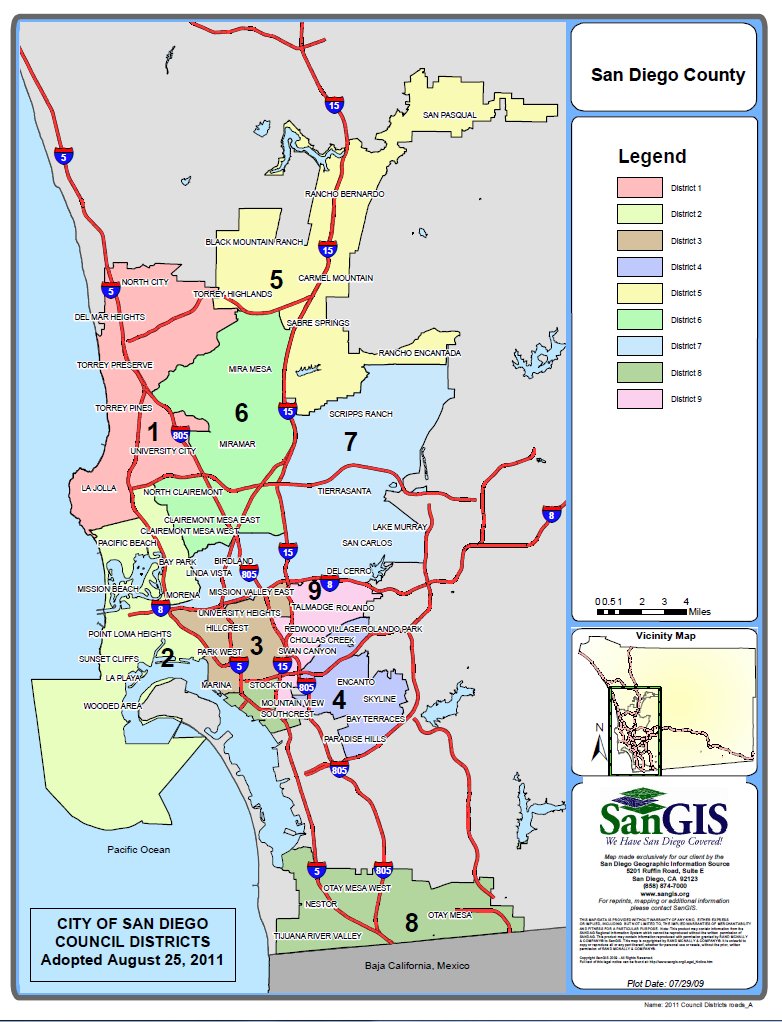
San Diego City Council District 1
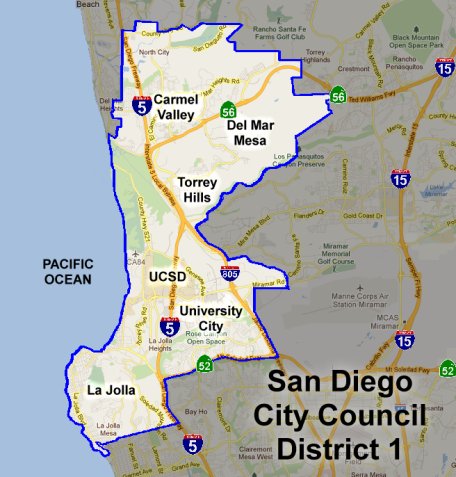
As of December 2012 San Diego City Council District One includes
the communities of Carmel Valley, Del Mar Heights, Del Mar Mesa, Pacific
Highlands Ranch, La Jolla and Bird Rock, Rose Canyon, lower San Dieguito
River Valley, Sorrento Hills, Sorrento Valley, Torrey Hills, Torrey Pines,
University City, and UCSD.
Party Affiliation (District 1 Registered Voters)
Between November 2007 and September 2008 Republican registrations in District 1 increased by only 42 voters while Democratic registrations increased by 3,416 voters.
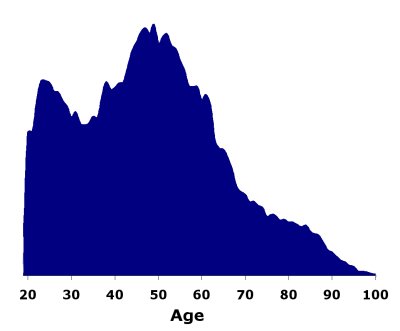
See the peaks from the "baby boomers" (and their children)?
[* move your mouse pointer over the graph for a breakdown by party]